Jetic Studio
The local web IDE for visual API discovery, workflow execution, memory control and trace inspection.
Jetic Studio is a local web application served by jetic dev (default http://localhost:8787). It is the visual interface to the Jetic runtime — the CLI stays the fundamental developer interface.
jetic dev
# or on a custom port
jetic dev --port 9000
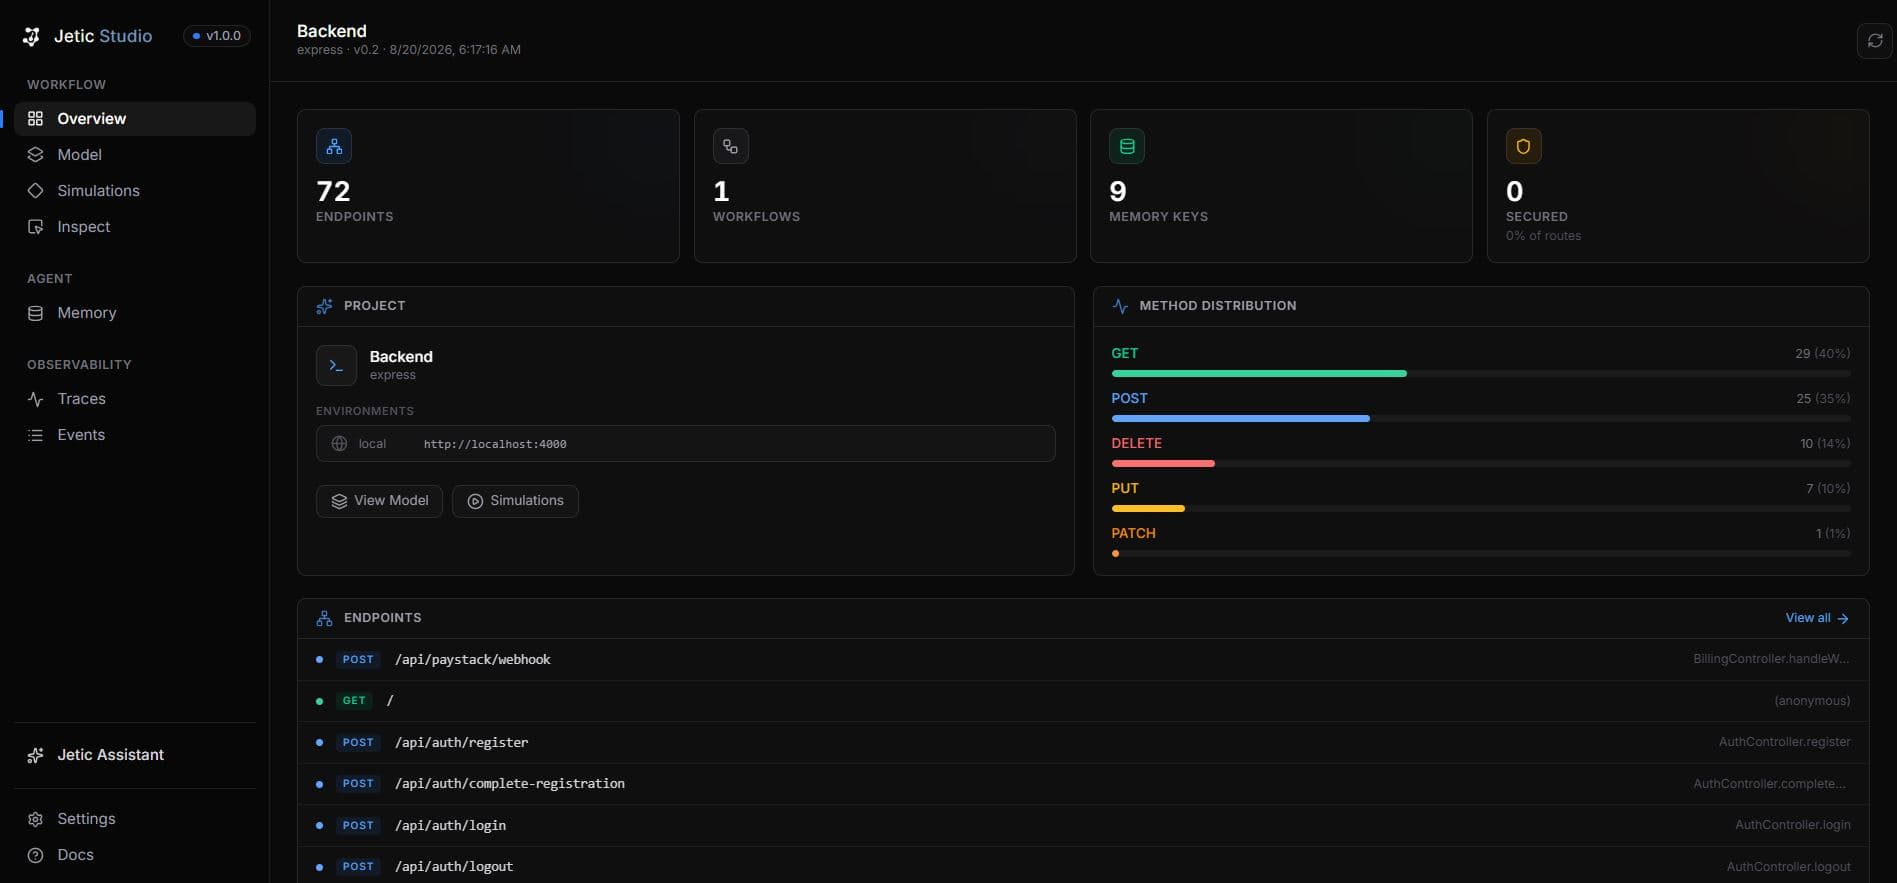
Workspace Overview — /overview
The command center for your API model: endpoint totals, method distribution, secured-route percentages, recent endpoints, active workflows and a preview of top memory keys.
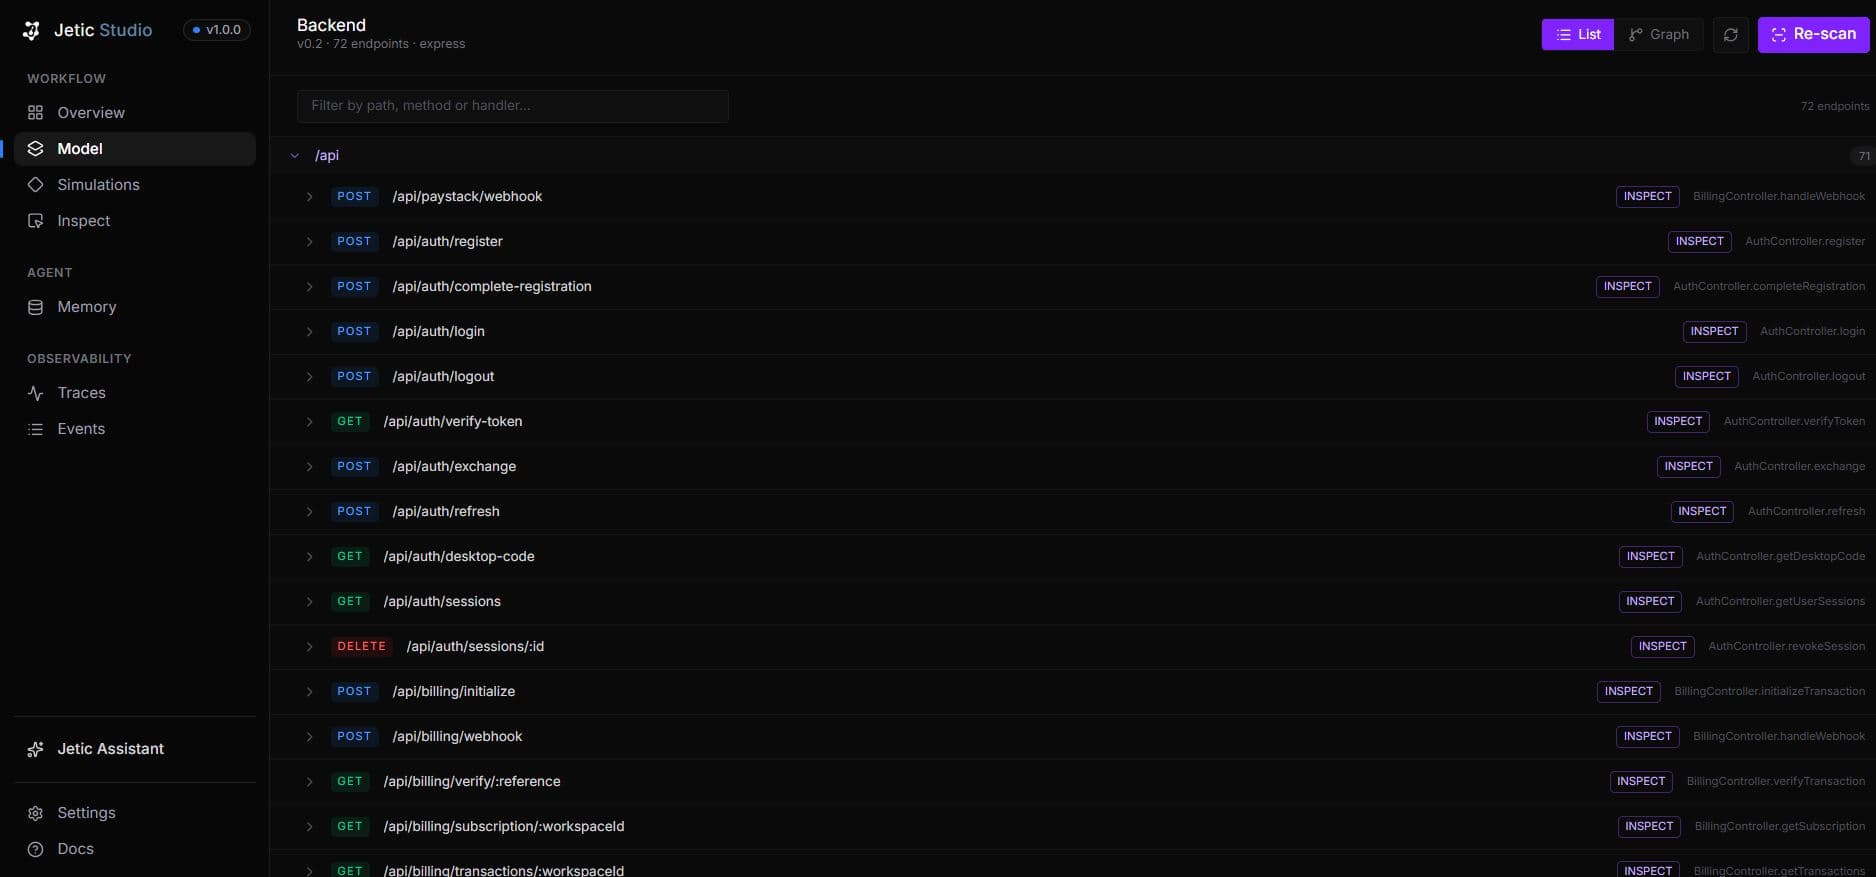
Behavioral Model — /model
An interactive explorer for .jetic/model.json.
- HTTP method filtering (GET, POST, PUT, DELETE, PATCH) and full-text search
- Request/response schema cards, security badges and middleware chains
- Environment switcher and one-click Inspect
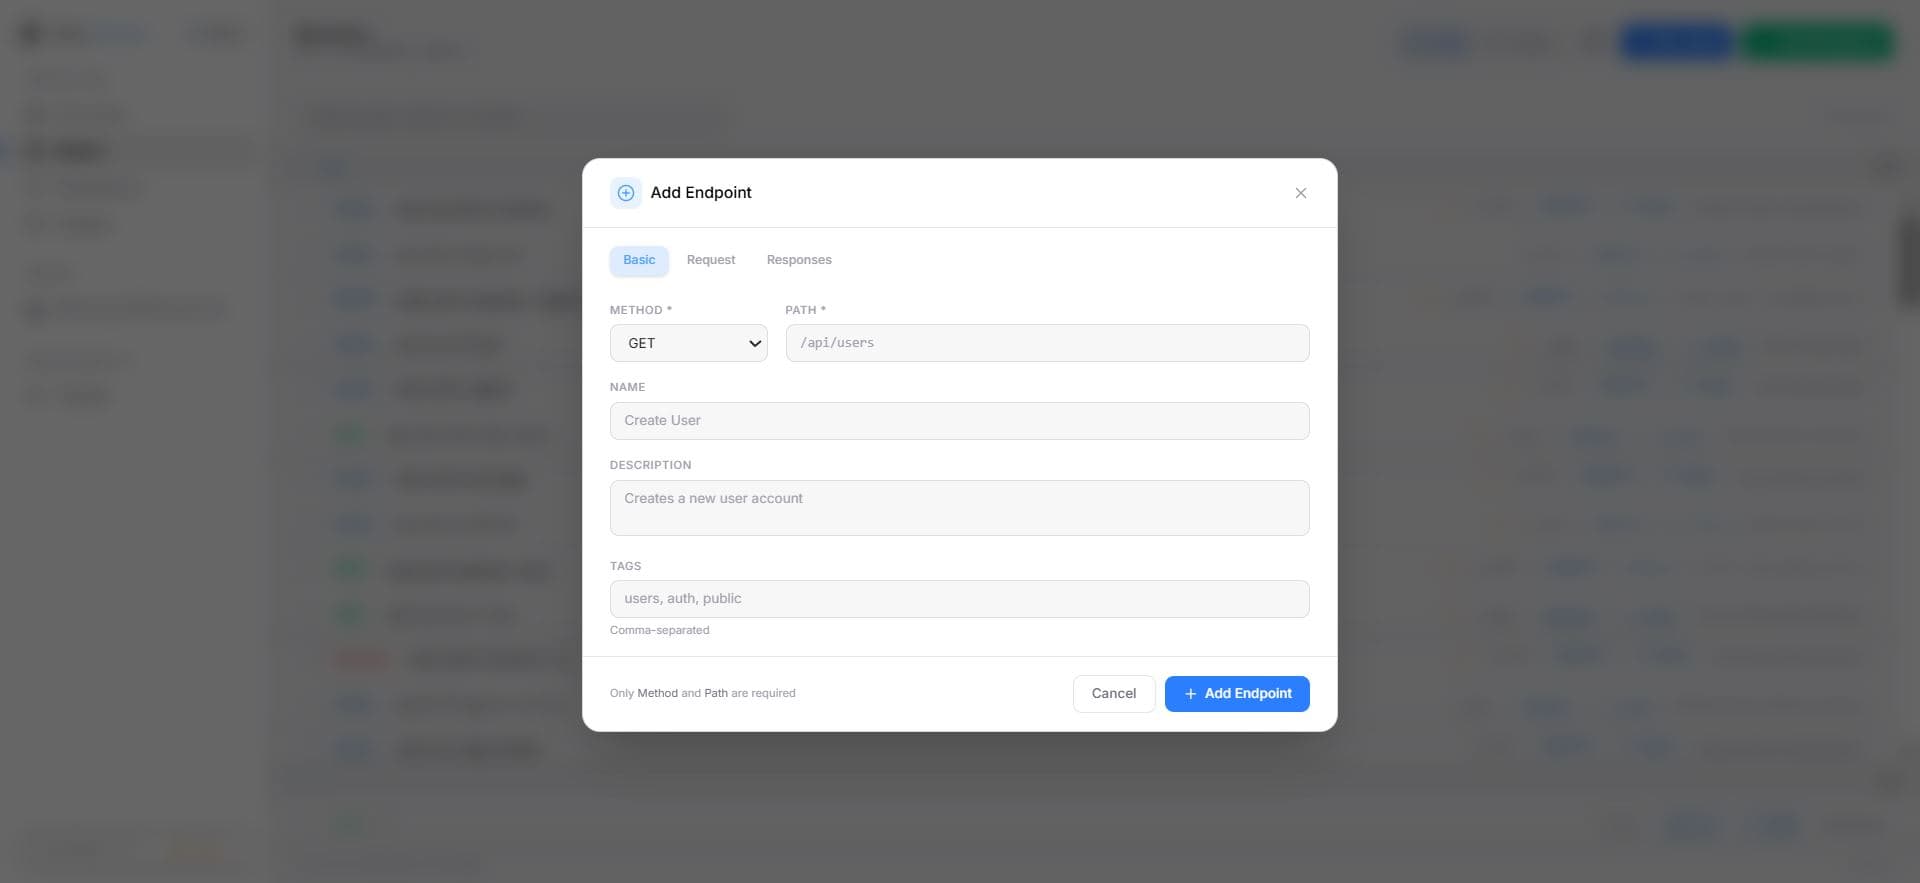
- Add Endpoint — manually define method, path, parameters, schemas and auth for any stack
Endpoint Inspect — /inspect
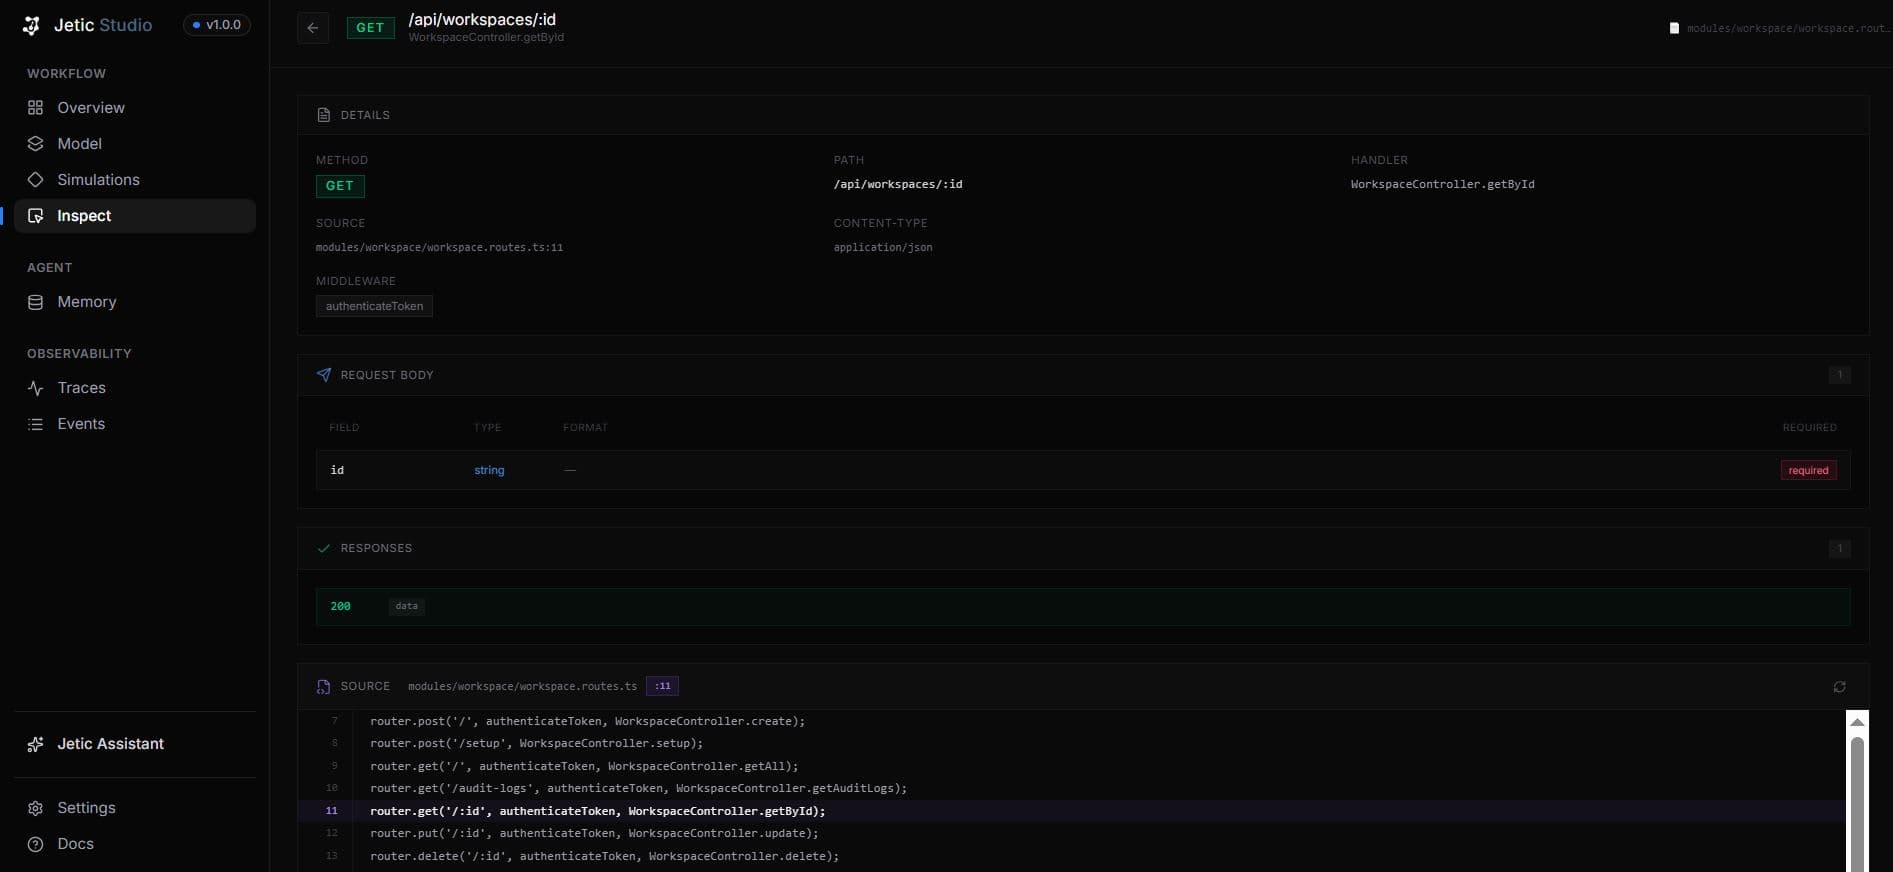
A deep-dive page for any single endpoint.
- AST source viewer — the backend handler centered on the exact line (e.g.
routes/orders.ts:42) - Related files navigator — imported controllers, services and type declarations
- Schema explorer — request body, query and path params, responses and discovered constraints
- Interactive REST client — call the live endpoint from the browser with real or generated data and auth injection
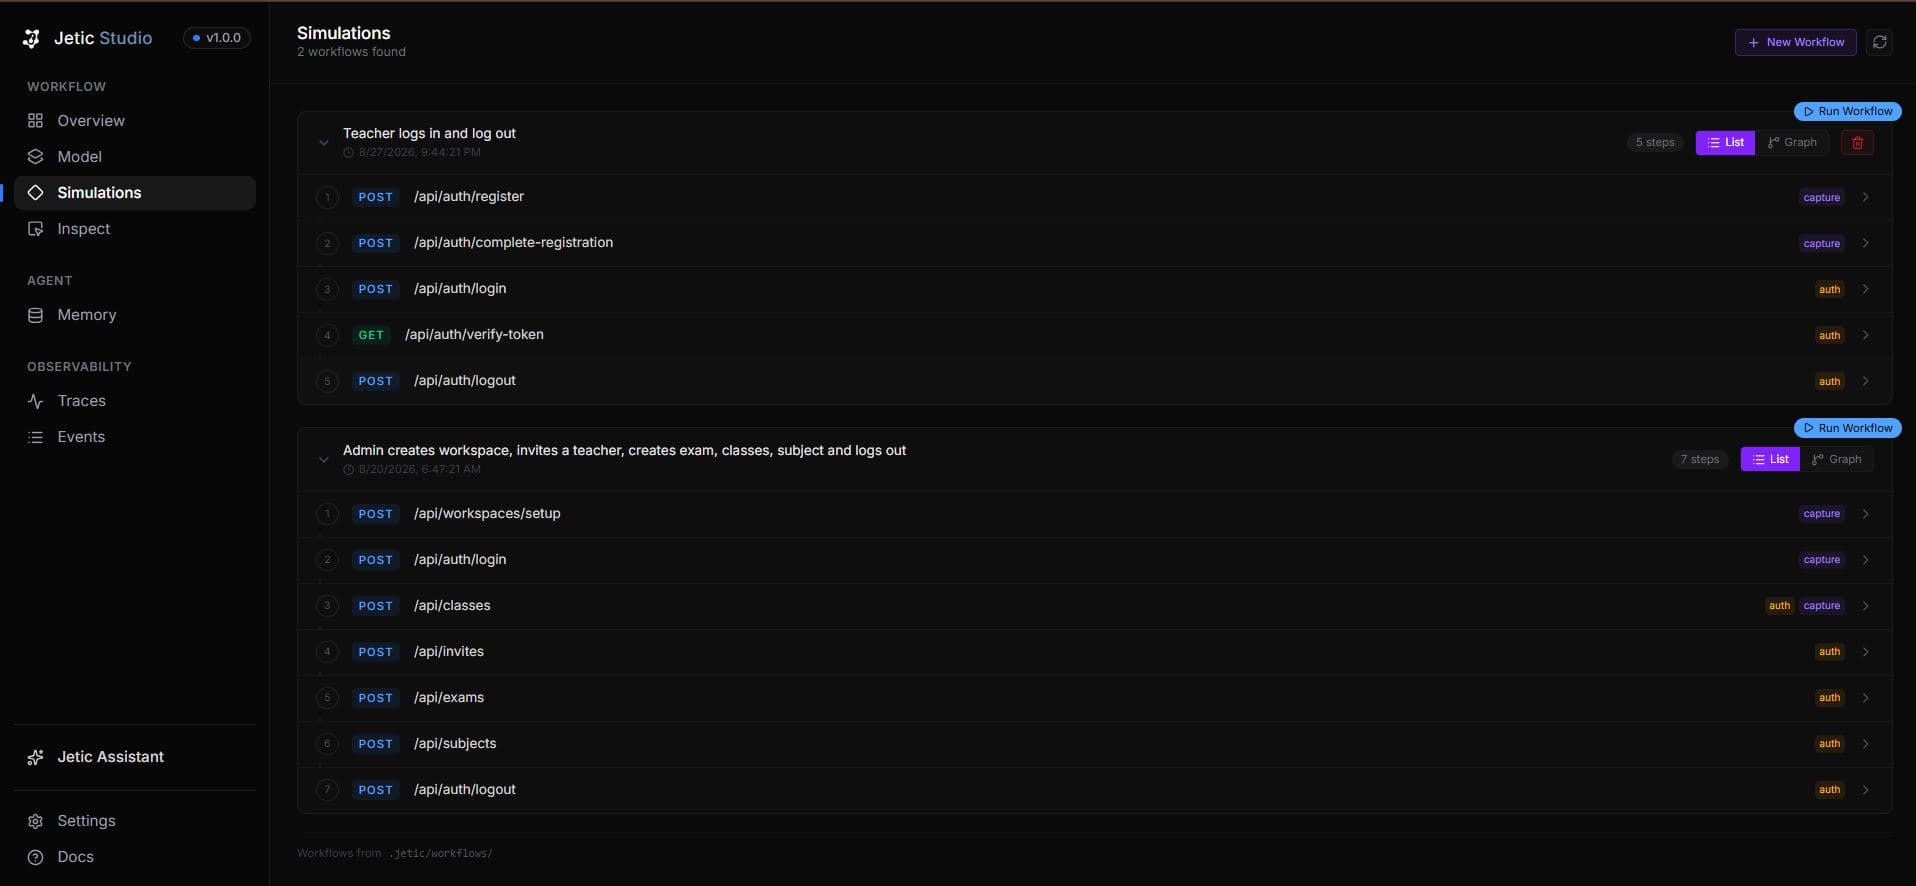
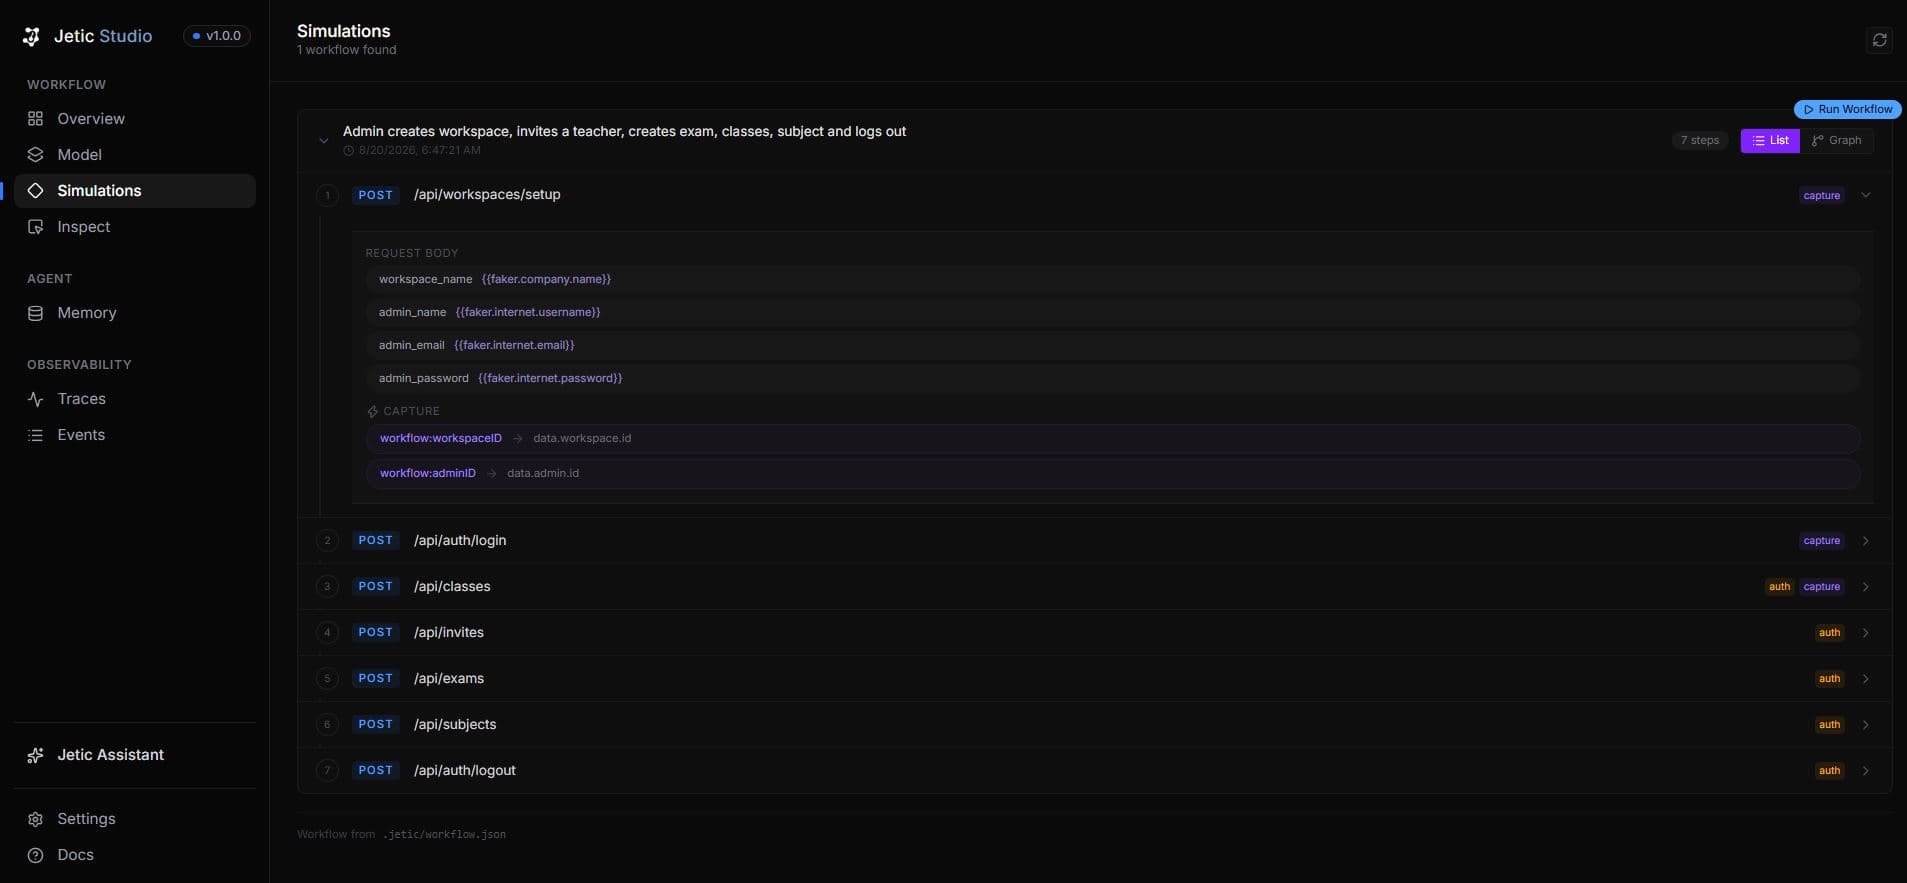
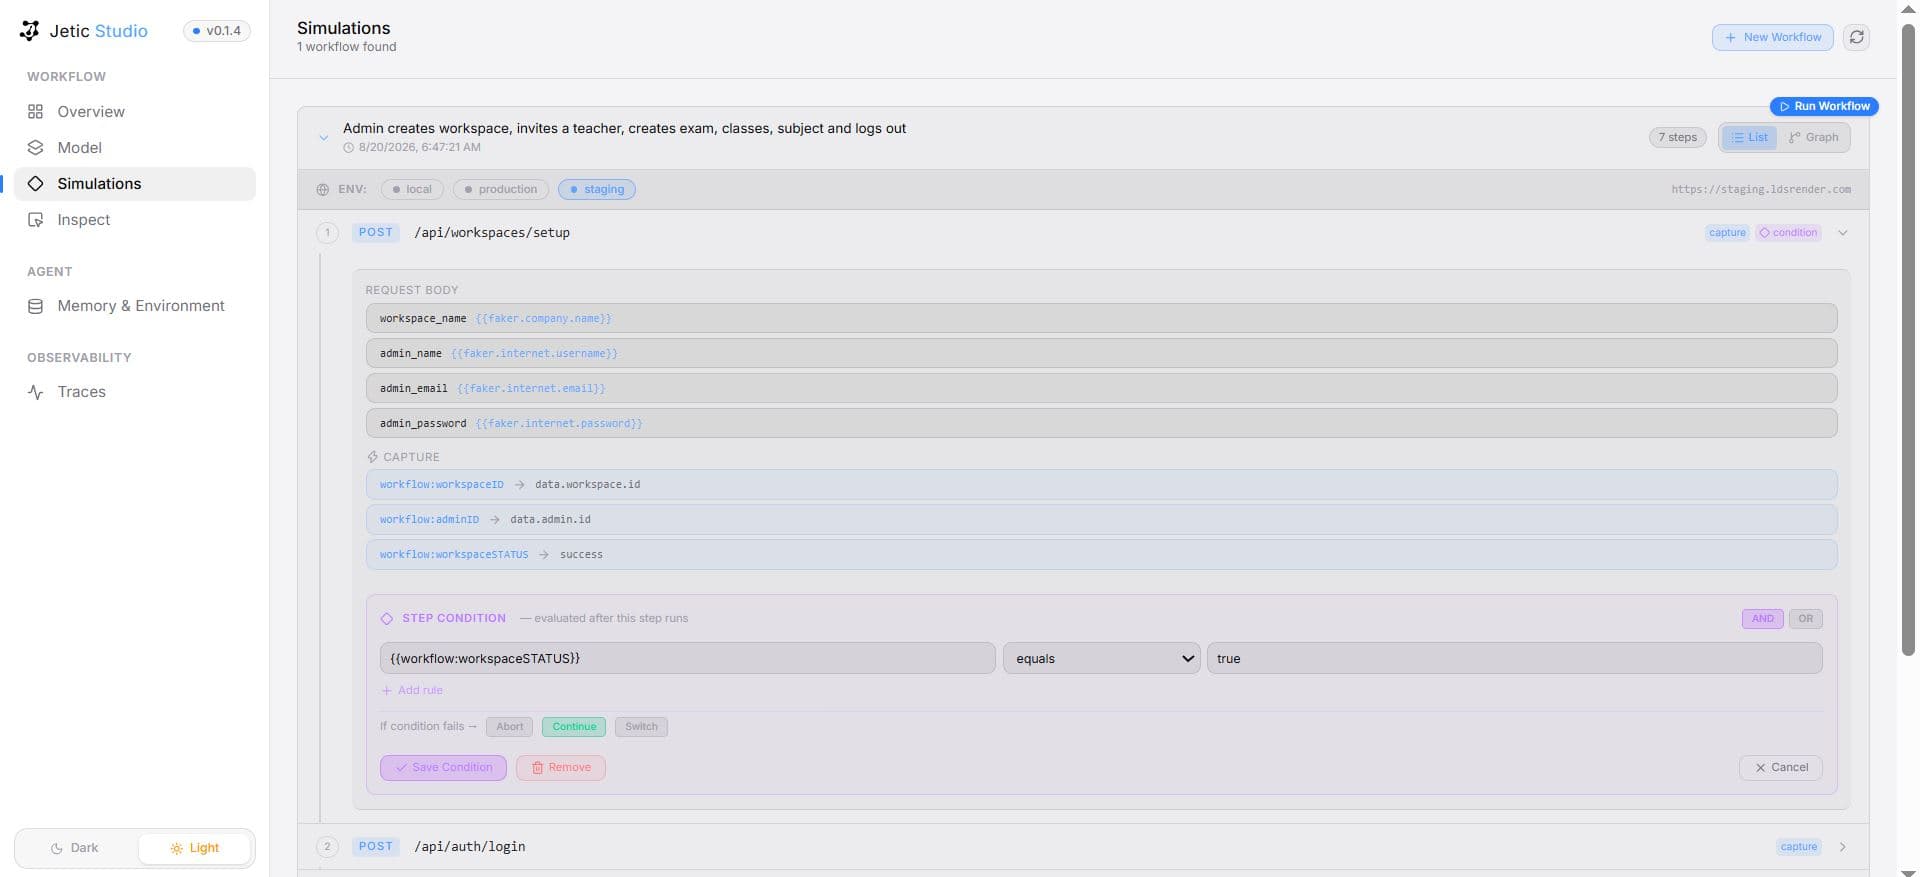
Simulations — /simulations
The saved-workflow editor and step-by-step runner.
- Live streaming — watch steps execute in real time over Server-Sent Events (SSE)
- Payload & injection inspection — expand a step to see resolved body values, injected
Authorizationheaders, expected vs actual statuses, and captured variables - Conditional and retry logic — steps can be skipped by conditions and retried on failure
Memory Inspector — /memory
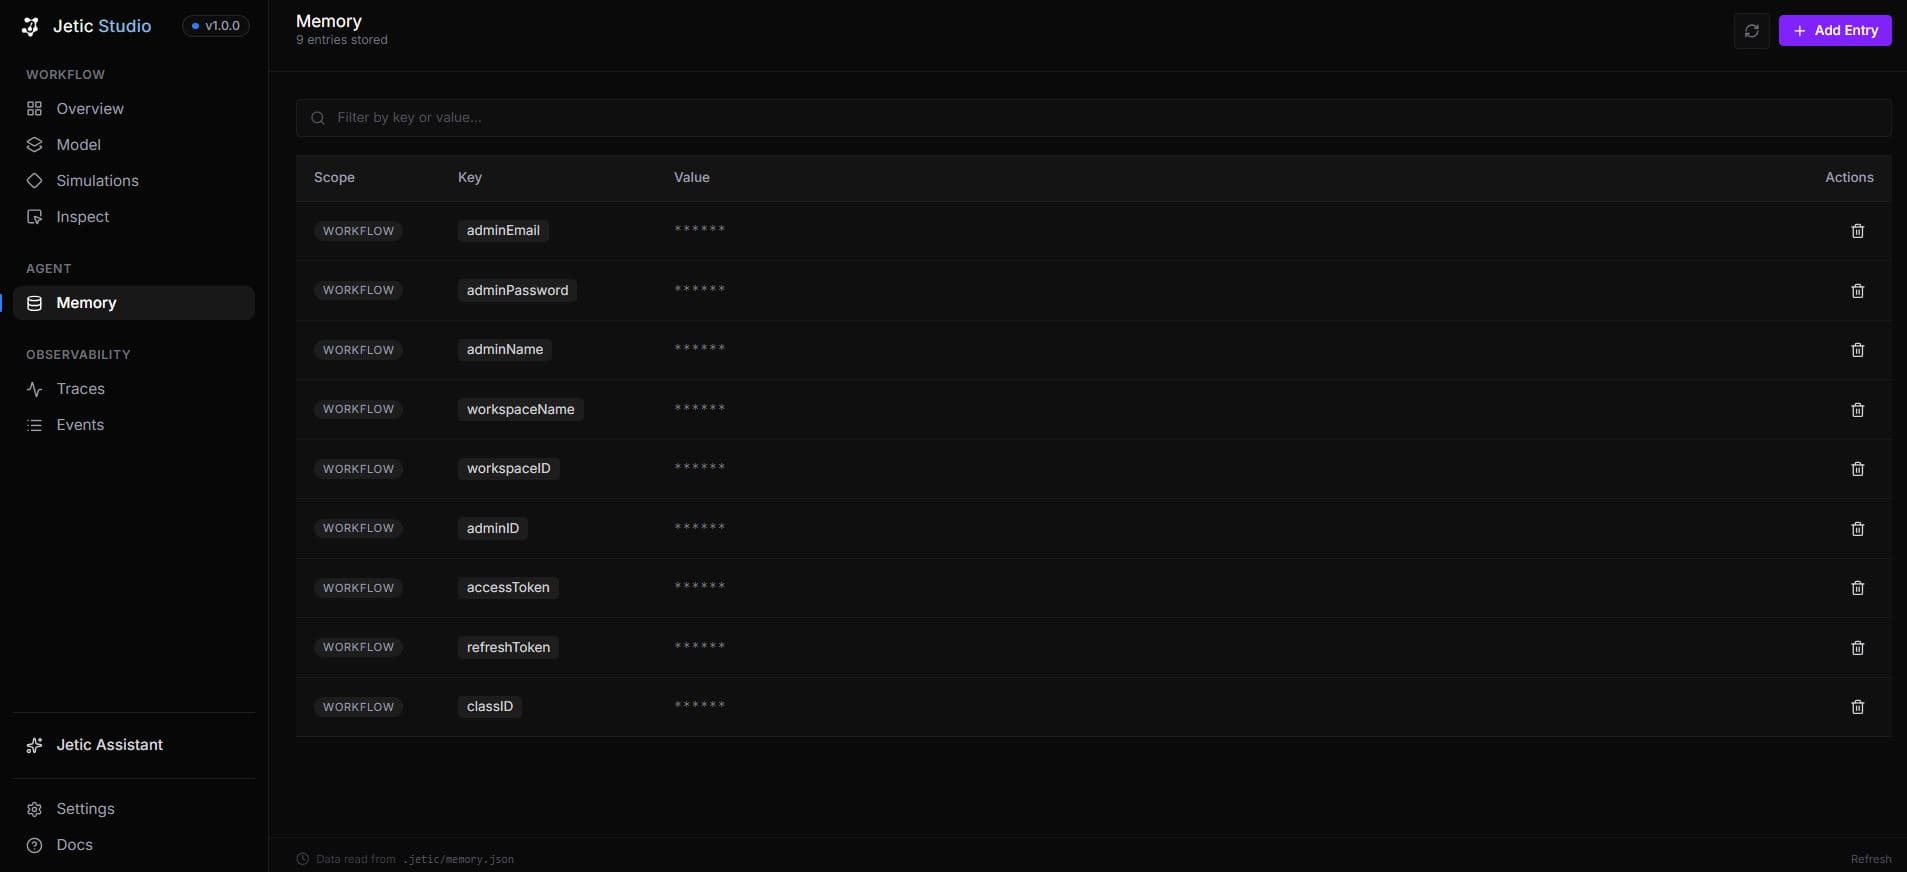
A live inspector for .jetic/memory.json.
- View authorization tokens, credentials, resource IDs and custom variables
- Add, edit or delete entries across the
workflowandglobalscopes - Clear state between runs
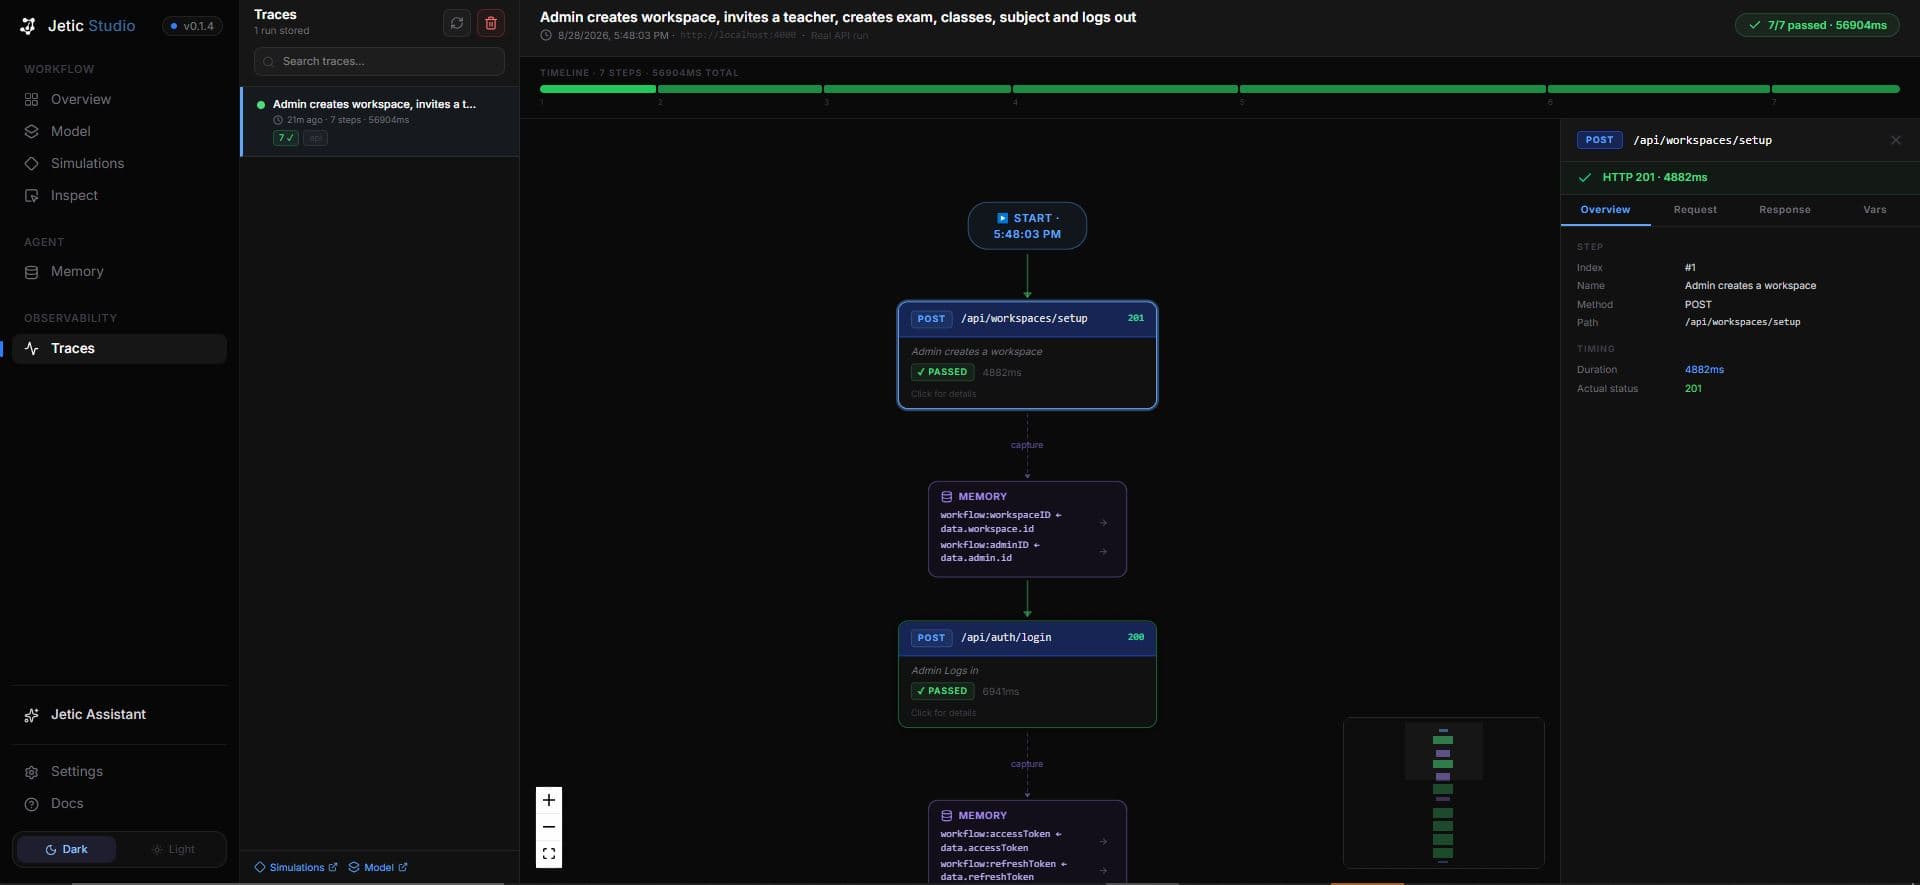
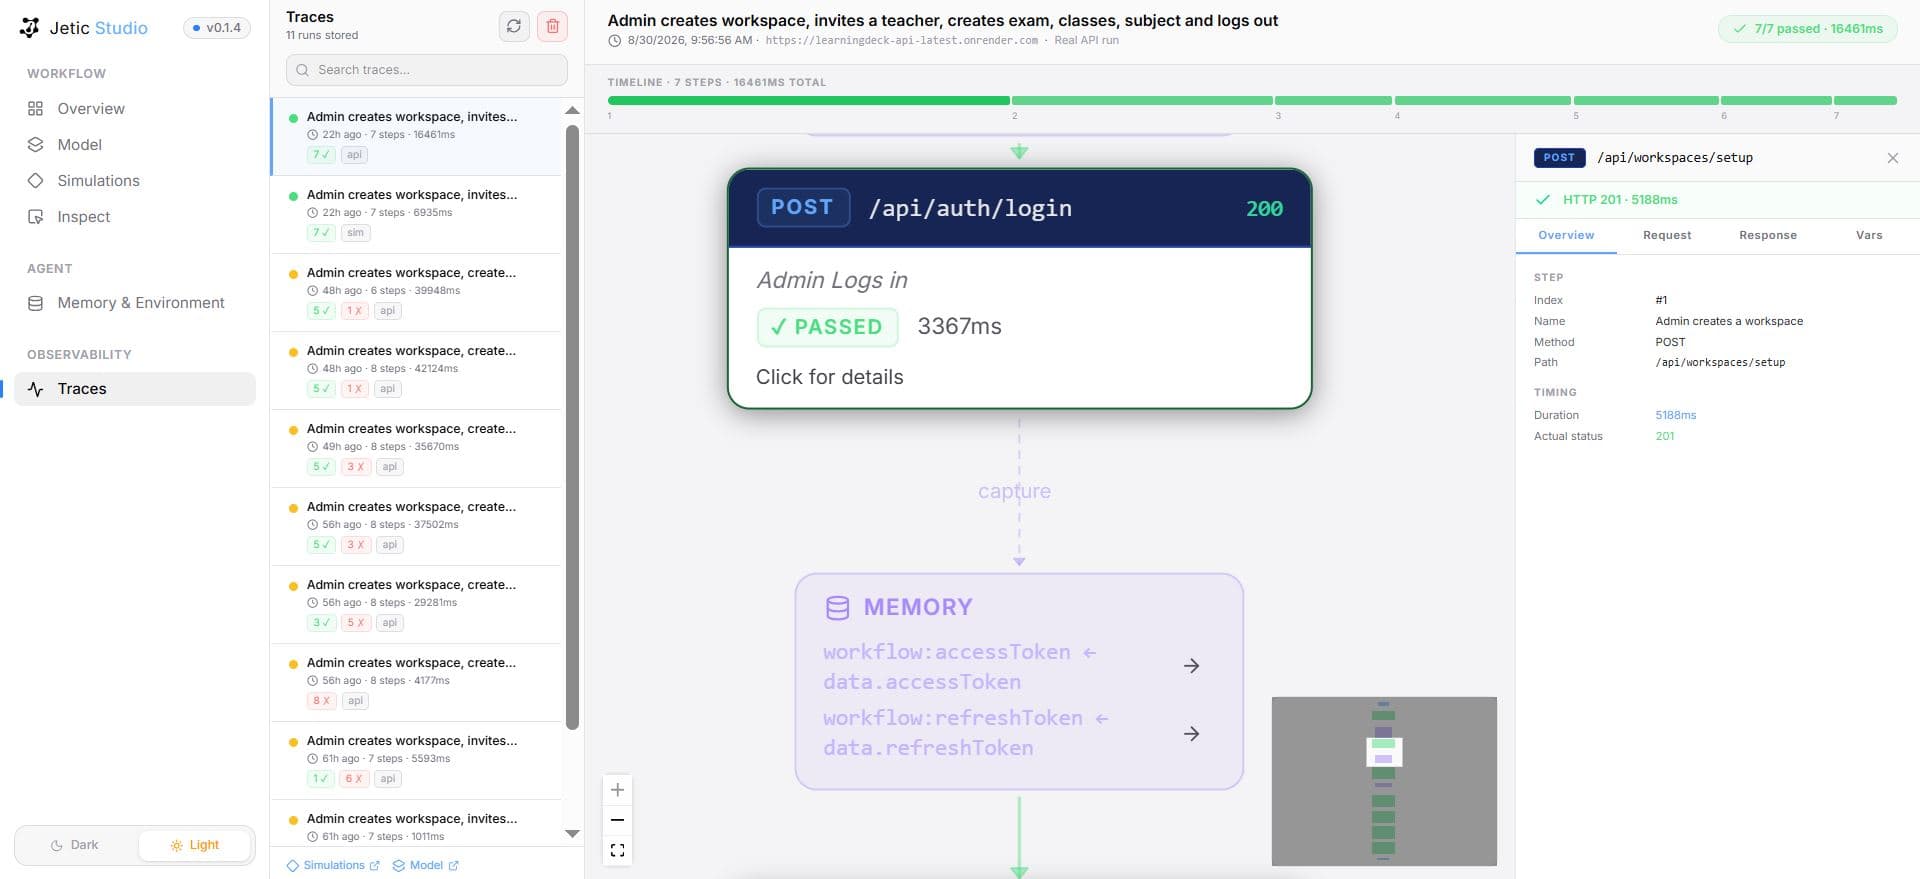
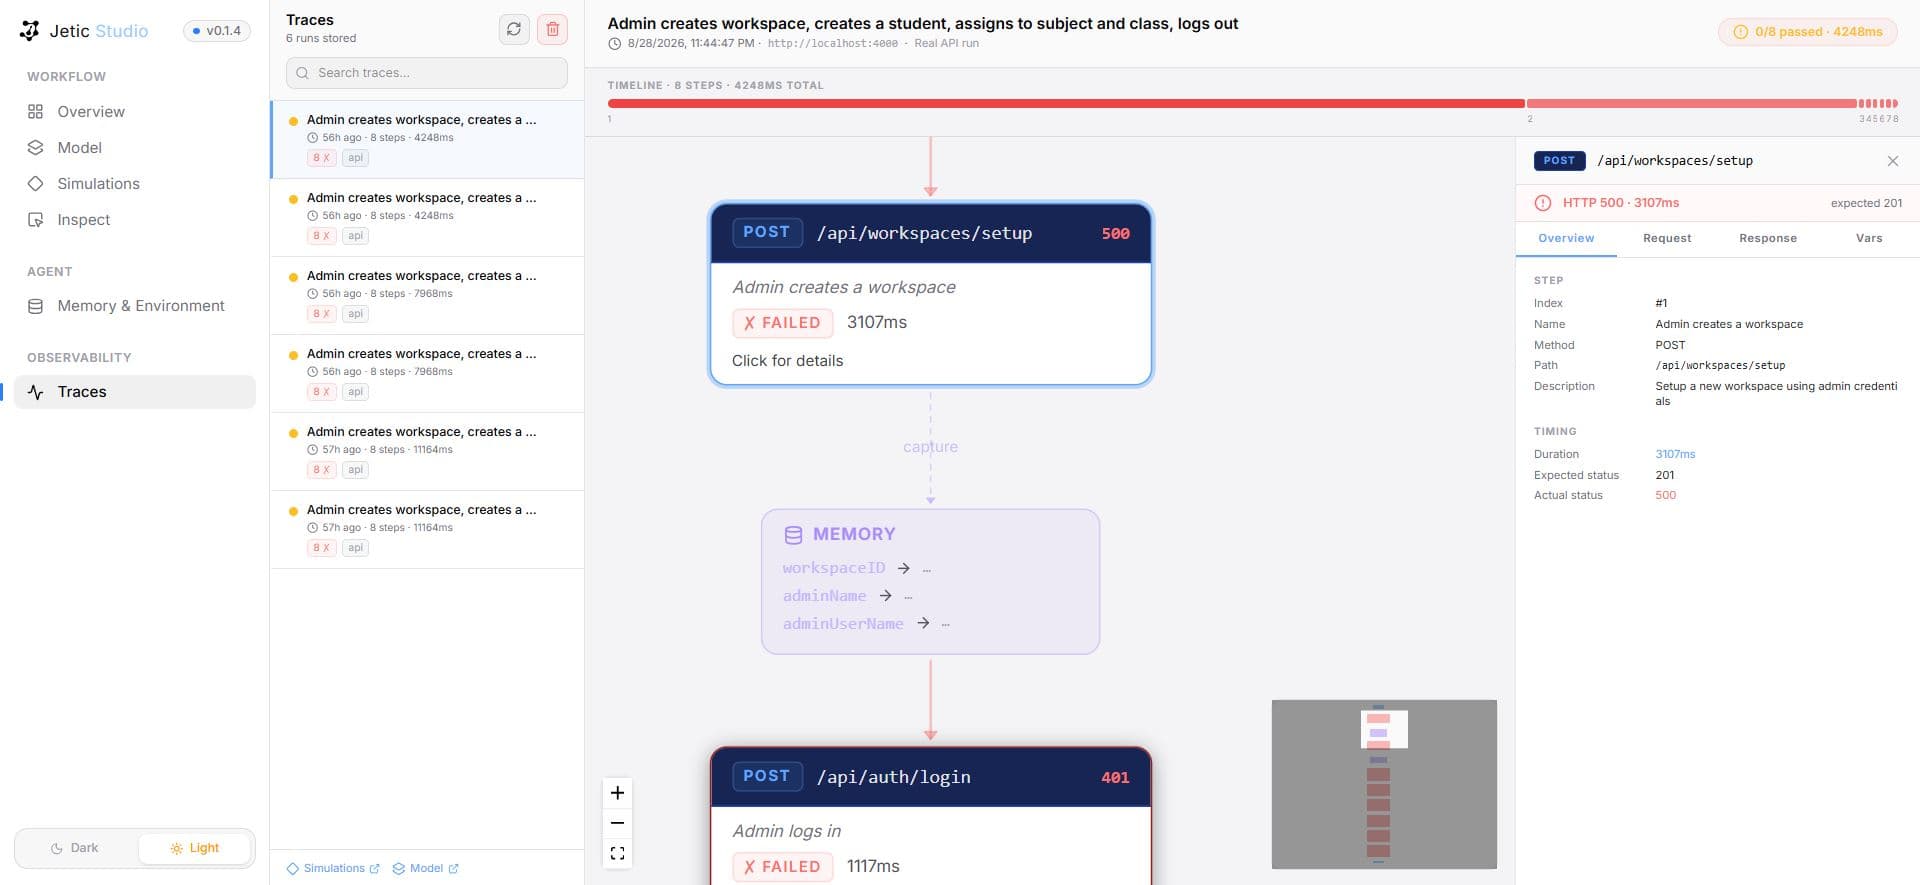
Execution Traces — /traces
An interactive node-graph visualizer for workflow runs.
- Node graph — steps as HTTP nodes linked by variable-capture nodes
- Timeline — proportional step latencies with pass/fail status
- Step drawer — injected vs standard headers, raw request body, JSON response, status checks and capture rules
File Changes — /changes
A real-time observer for source edits, powered by a zero-dependency file watcher.
- Live SSE stream (
/api/changes/stream) pushes modifications to the UI without a reload - Live connection status, pending file count, project root and watched-since timestamps
- Filter by Source, Config, DB, or a custom query
- Integrates with
jetic_get_changes/jetic_clear_changesso AI assistants re-index only modified files - Clear Changes and Rescan & Sync Model quick actions
How /changes powers incremental AI updates
The watcher writes .jetic/changes.json. When your editor's agent calls jetic_get_changes, it reads only the listed files instead of the whole codebase, then updates the model and calls jetic_clear_changes.